The Dashboards
Two Dashboards.
One Complete Picture.
01
Senior Management · Finance · Product
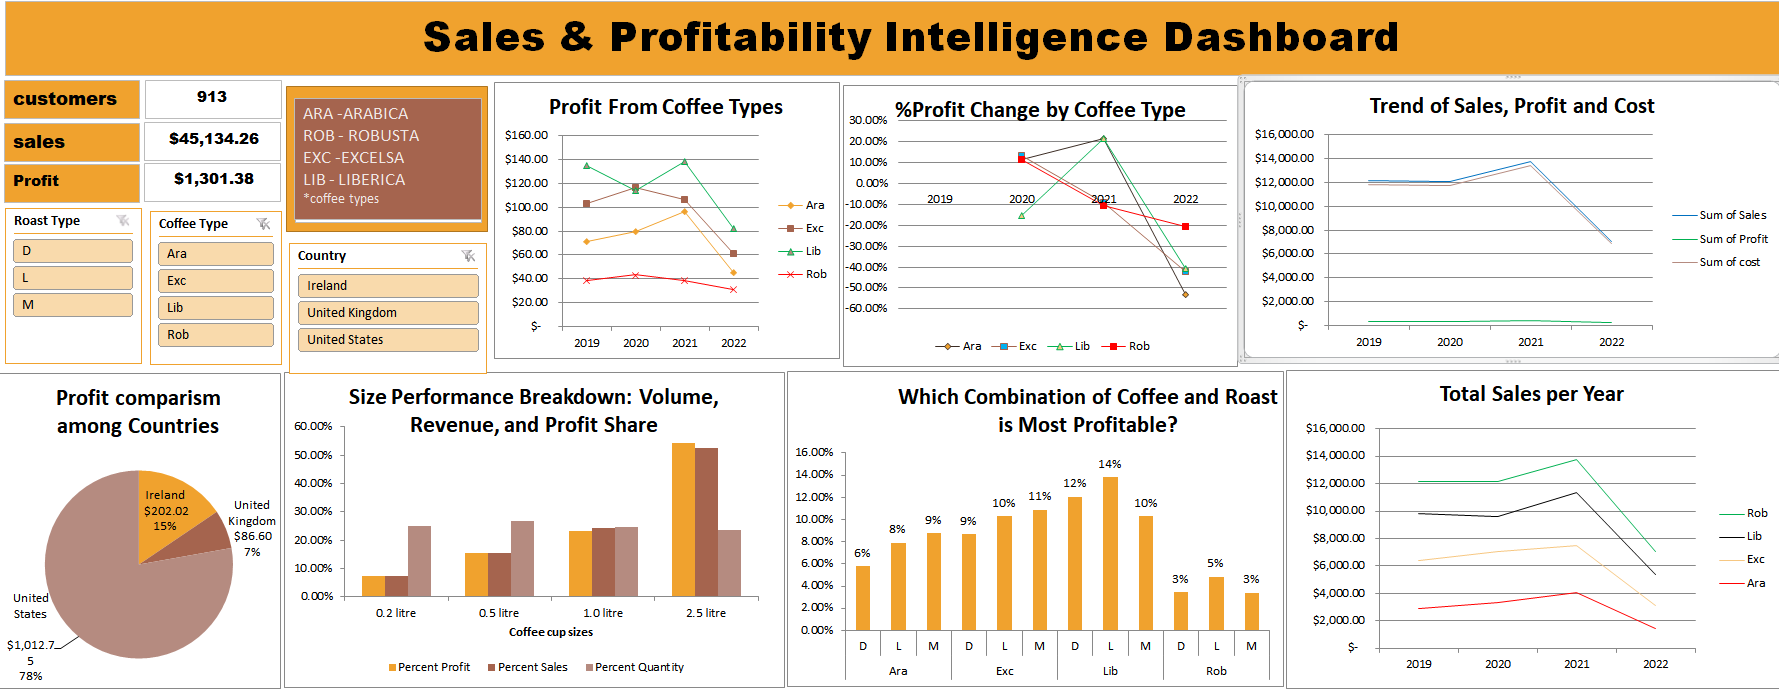
Where Is the Money? A Coffee Profitability & Sales Analysis
Sales & Profitability Intelligence Dashboard
Built to answer the business's most pressing commercial questions — which products are making money, which markets are worth investing in, and whether revenue growth is actually translating into profit.
Profit per Country — US, UK & Ireland comparative analysis
Coffee Type & Roast Combination Profitability
Size Performance Breakdown: Volume, Revenue & Profit Share
Sales by Year — 4-year revenue trend
% Profit Change by Coffee Type (Year-over-Year)
Dashboard Preview
5
Visuals
3
Countries
4
Coffee Types
Dashboard Preview
6
Visuals
913
Customers
Top 9
Profiled
02
Marketing · Operations · Customer Success
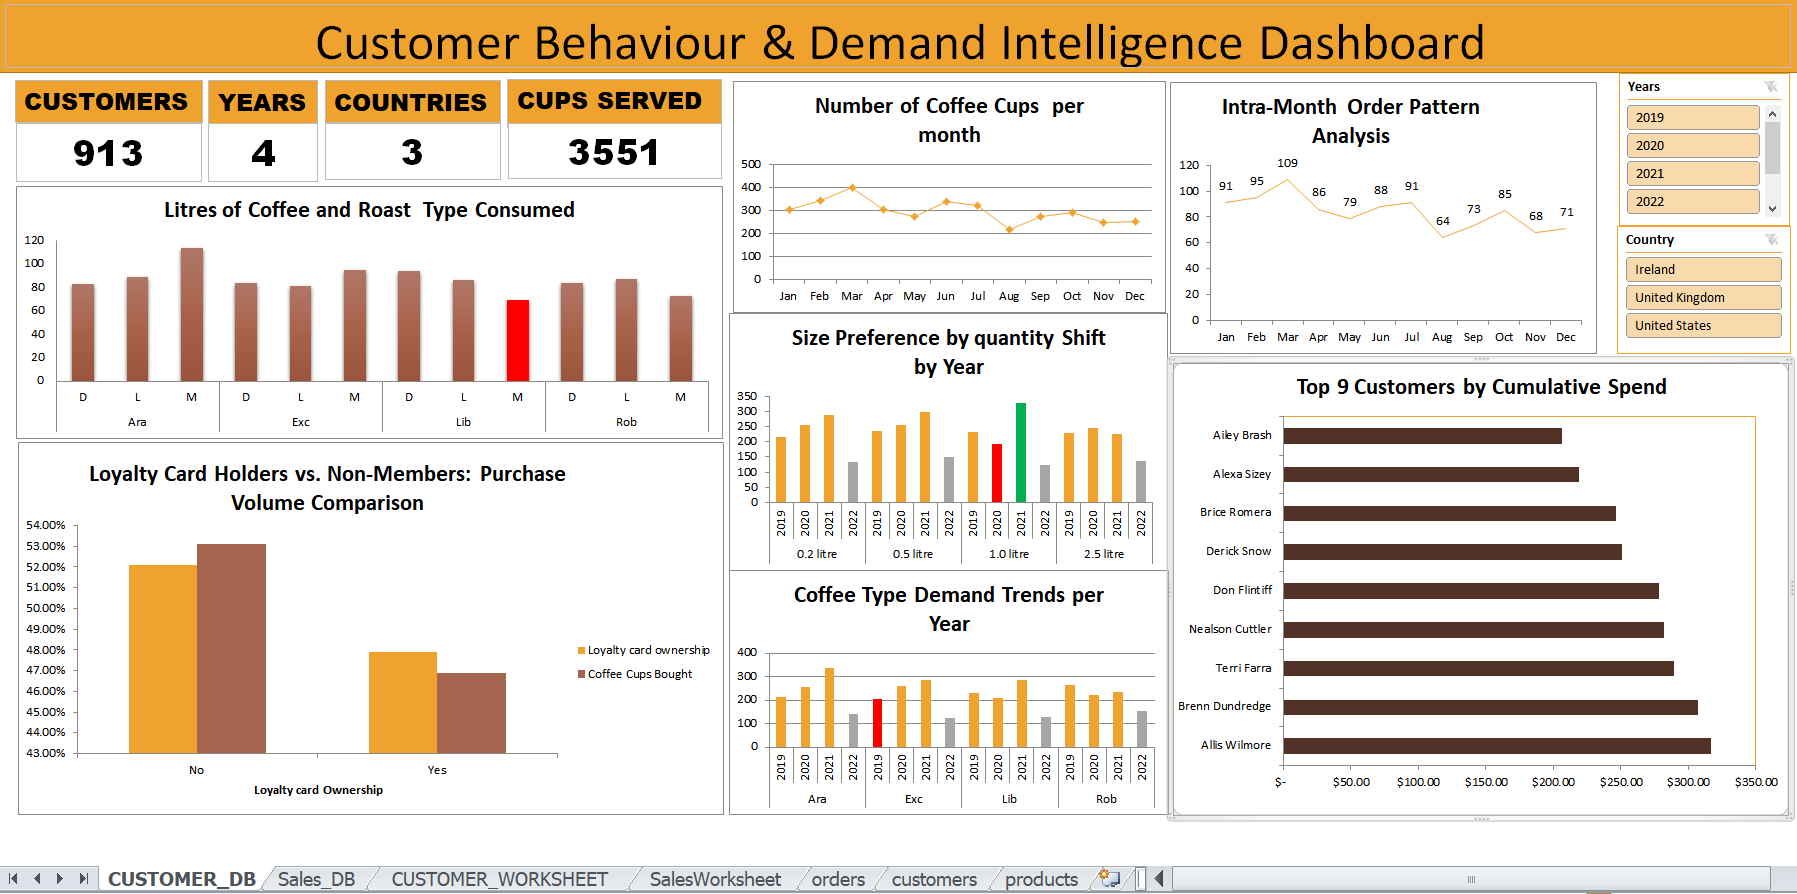
Who Is Buying, What They Want, and When They Come
Customer Behaviour & Demand Intelligence Dashboard
Built to answer the human side of the business — who the customers are, what patterns drive their behaviour, and when and how demand moves across the year.
Monthly Order Volume Trend — seasonal peaks & troughs
Coffee Size Preference Shifts by Year
Coffee Type Demand Trends by Year
Loyalty Card Holders vs. Non-Members Purchase Comparison
Top 9 Customers by Cumulative Spend
Customer Favourite Coffee & Roast Type